Explorer
The Explorer provides a detailed view of various metrics in the Dashboard. For example, you can click the Print User Print Cost metric on the Dashboard to see how much each Region or Department spends on printing per employee per month. Available metrics include Color Volume, Single-sided Volume, User to Device Ratio, Annual Cost, Annual Volume, and Monthly Cost.
Explorer View
To access the Explorer:
- Go to Print Analytics > Dashboard.
- Click on the metric that you want to learn more about. The data appears in the Explorer view and "Explorer" is displayed in the header, as shown below. What you see in the Explorer depends on the metric you selected on the Dashboard.
Drilling down into your data
In the Explorer, you can quickly go from a summary view of your data to specific details about printing activity in your organization. It's easy to drill down into your data to see exactly what you're looking for. For example, if you're looking at monthly color volume in a specific region, you can click any category shown within that view, such as Department, Print User, Device, or Application, to view more details about each specific category.
You can easily navigate back and forth between a summary view and specific data categories by clicking the icons along the left-hand side of the Explorer.
Using the Search Tool
You can quickly locate an individual print user or device in your organization by using the Search tool. To search for a particular user in your organization:
- Click the Search prompt and type a name. If there's a match, the Login name and Department information will appear below the Search field, as shown below.
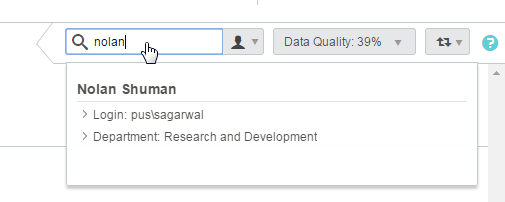
- Click the user name or any of the related information to view print information specific to the individual print user.
You can also search by device:
- Click the arrow to the right of the Search field.
- From the drop-down list, select Device. You can search by serial number, IP address, hostname, or MAC address. As you type, the search field will display a list of matches. You can click a result to view details about the individual device. Currently inactive devices will appear dimmed and cannot be clicked.
Exporting a Comma-separated Value (CSV) File
Whenever you are in Grid View throughout the Print Analytics Explorer, you can export a CSV file by clicking on the CSV Export button. The file will be downloaded according to your browser settings. This allows you to easily export Print Analytics data for offline use.
Switching between Table View and Chart View
When you're in Explorer view (but not on the Summary page), you can easily switch between Chart view and Table view, shown below. Simply click the Switch View button to toggle between the two options. Chart view is displayed by default.
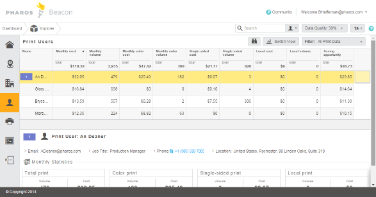
Table View
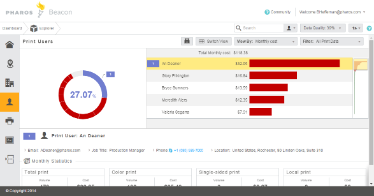
Chart View
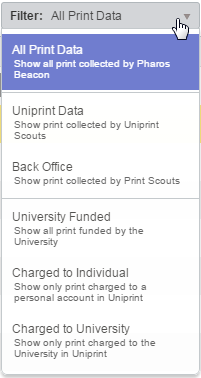
Filter Your View
In the Explorer, you can quickly filter your view to show only specific sources of print volume. For example, Uniprint customers can filter their view to display only the print that is charged to the university (e.g. print jobs charged to cost centers, grants, etc.) The default view is All Print Data, which includes print data collected by both Uniprint Scouts and Print Scouts (when applicable).
To open the Filter options, click the Filter button and choose an option from the list, shown here.